Chapter 7 Principal Component Analysis
Generating Example Data
R=cbind(c(0.924,0.381),c(0.381,-0.925))
D=diag(c(29.296,0.149))
Sigma0.5=t(R)%*%sqrt(D)%*%R
temp=t(Sigma0.5%*%matrix(rnorm(200),nrow=2))
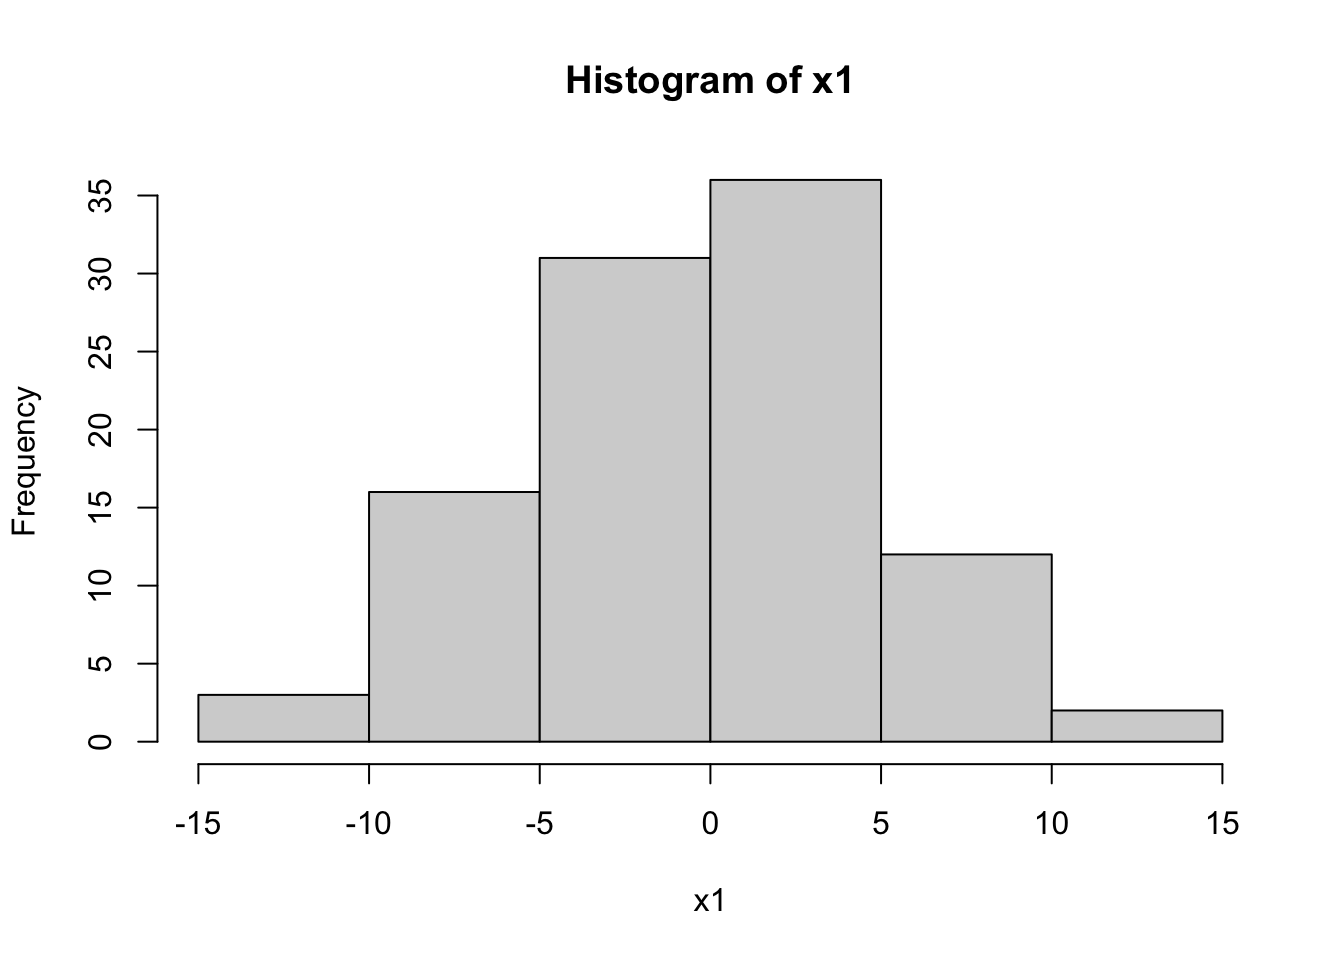
x1=temp[,1]
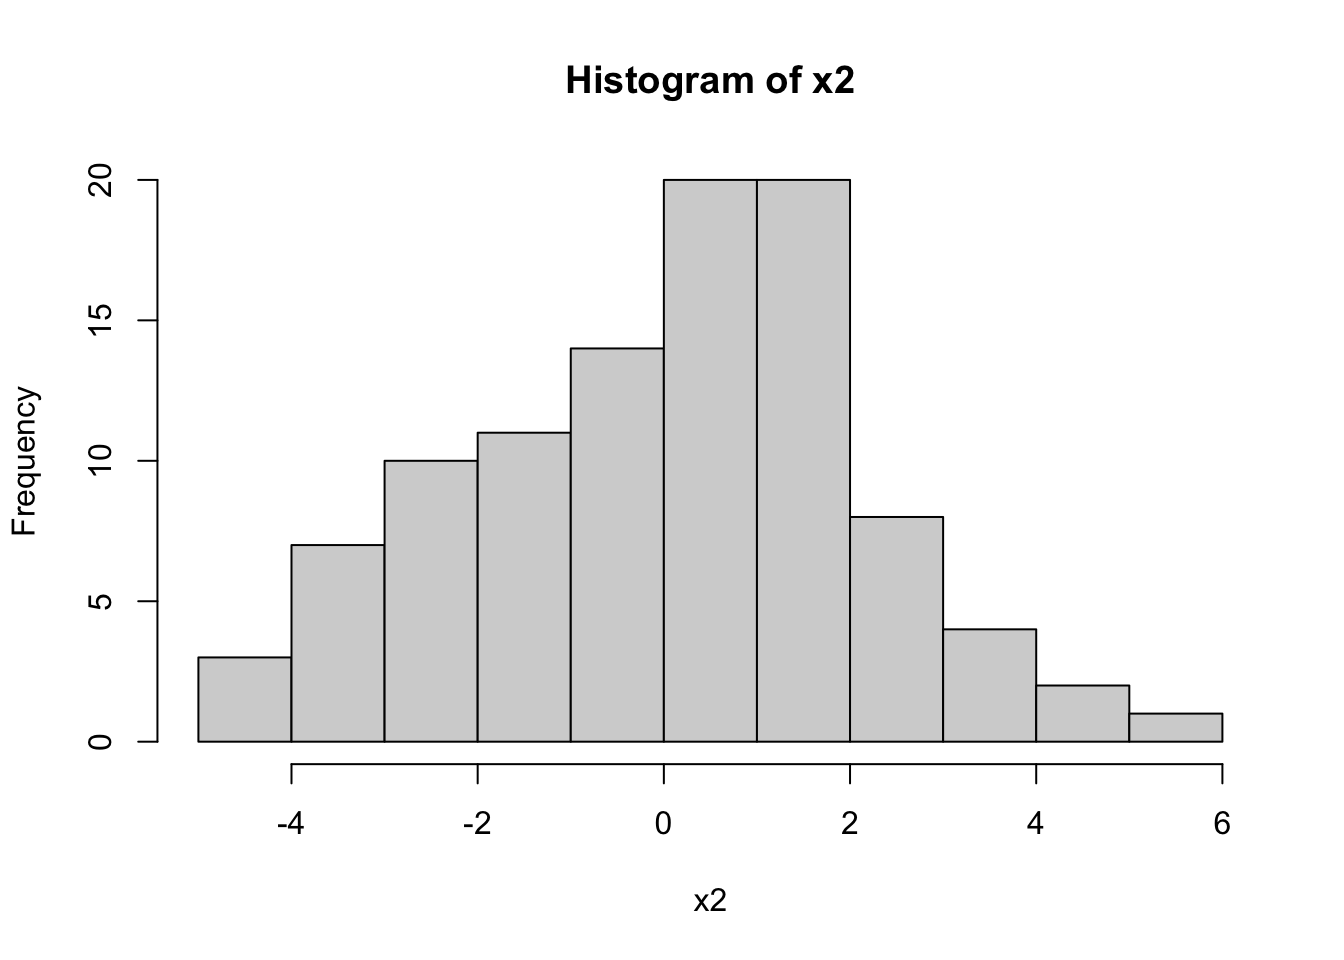
x2=temp[,2]
x1=x1-mean(x1)
x2=x2-mean(x2)
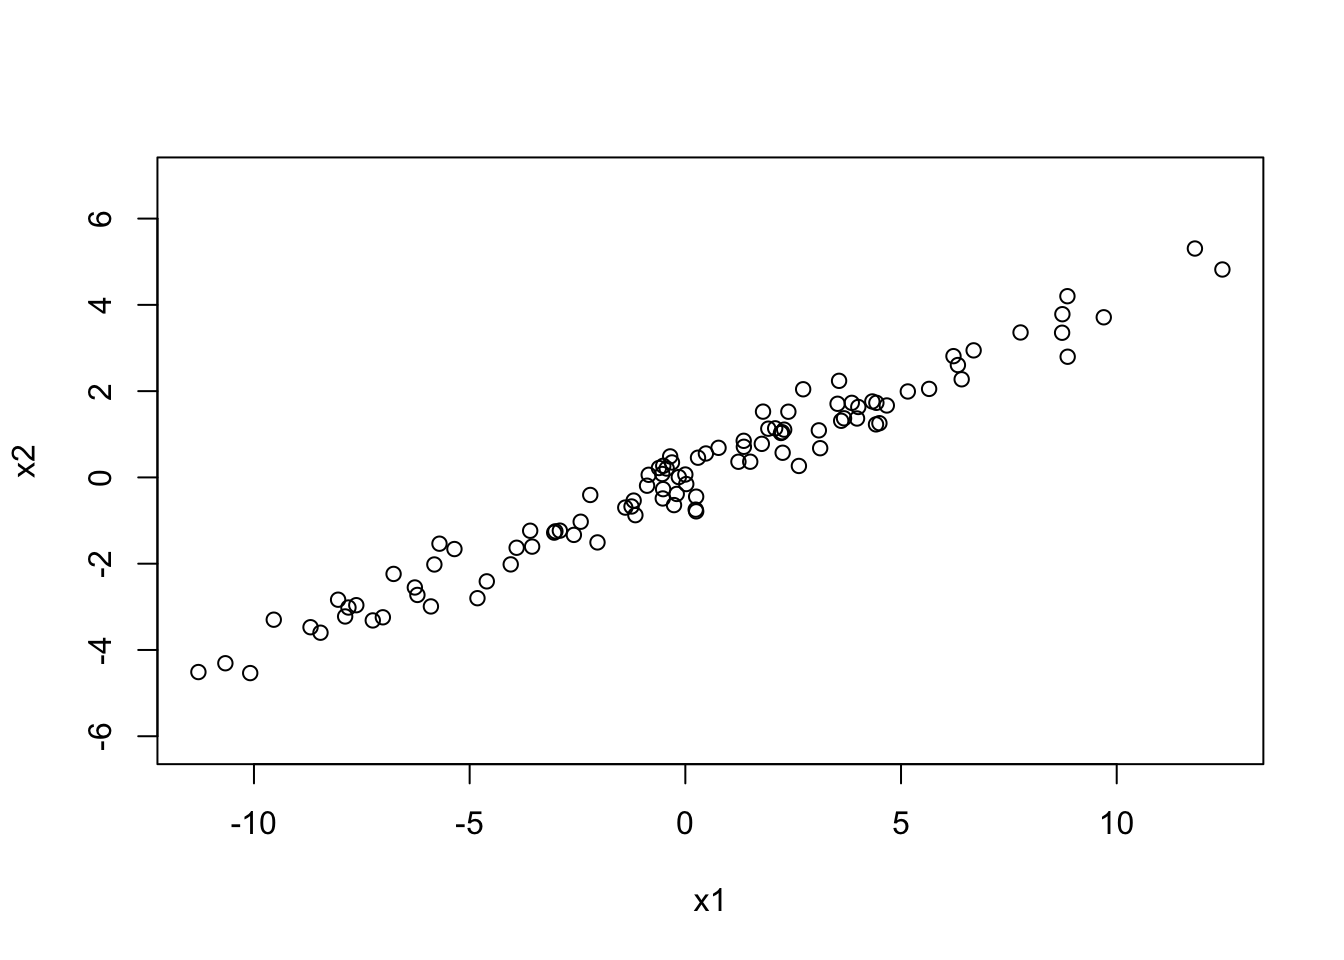
#Plotting Data
plot(x1,x2)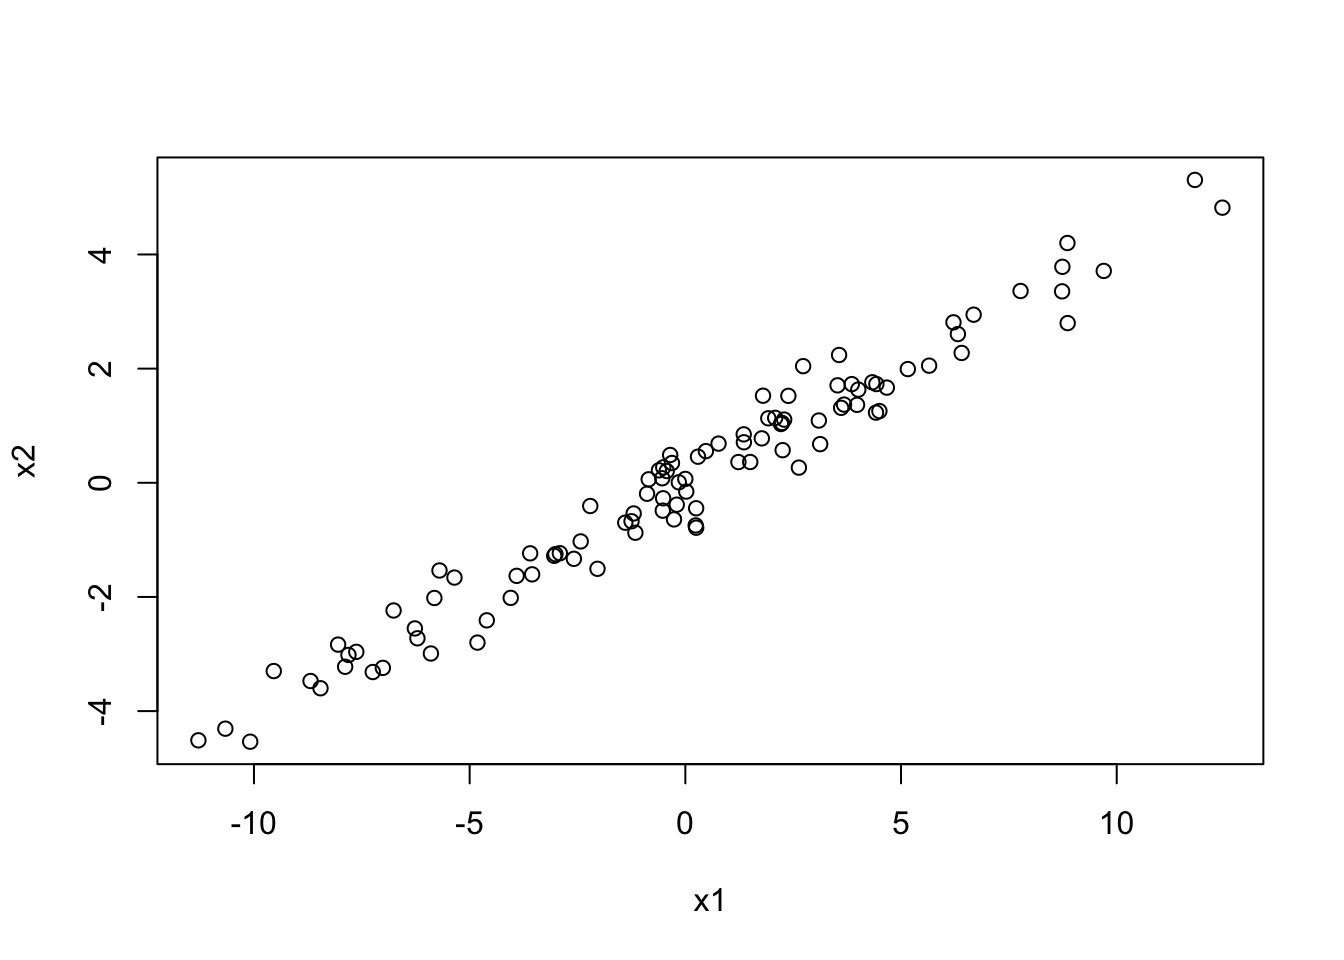
Principal Components
##          x1        x2
## x1 26.30955 10.674828
## x2 10.67483 4.491807## eigen() decomposition
## $values
## [1] 30.6635603 0.1378015
##
## $vectors
## [,1] [,2]
## [1,] -0.9259407 0.3776689
## [2,] -0.3776689 -0.9259407Checking Orthonormality
plot(x1,x2,asp=1)
xrange=min(x1)+(0:100)/100*(max(x1)-min(x1))
lines(xrange,v1[2]/v1[1] * xrange,col='red')
lines(xrange,v2[2]/v2[1] * xrange,col='red')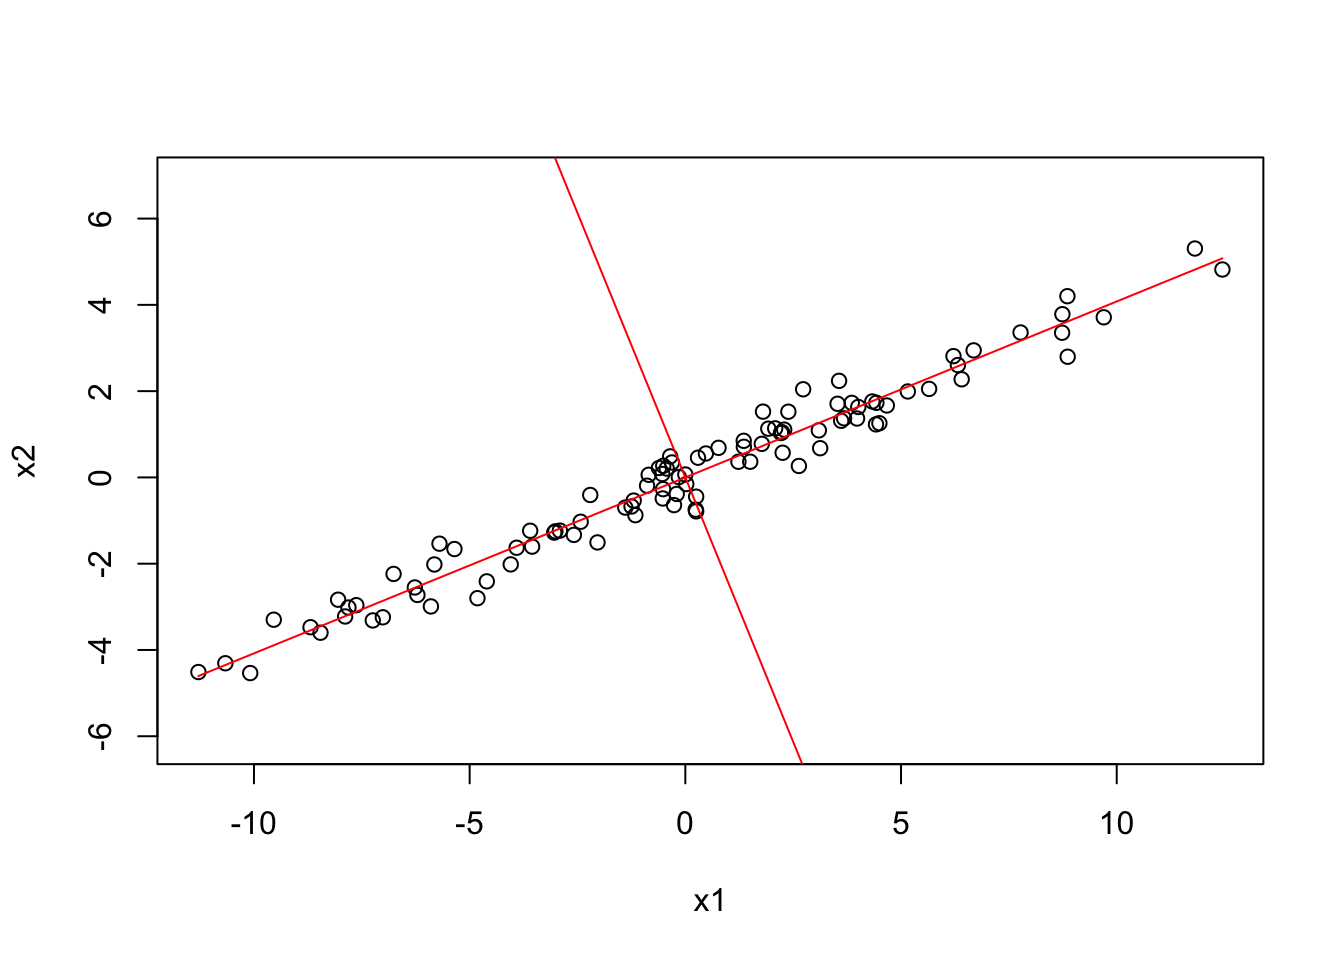
Rotating Data with Principal Components
##              v1           v2
## v1 3.066356e+01 9.524201e-16
## v2 9.524201e-16 1.378015e-01
##              x1         x2
## [1,] -4.0479947 -2.0162488
## [2,] -0.4316620  0.2059447
## [3,]  3.0948597  1.0908917
## [4,] -3.5970454 -1.2360385
## [5,]  3.6123526  1.3130242
## [6,]  0.2515032 -0.7869887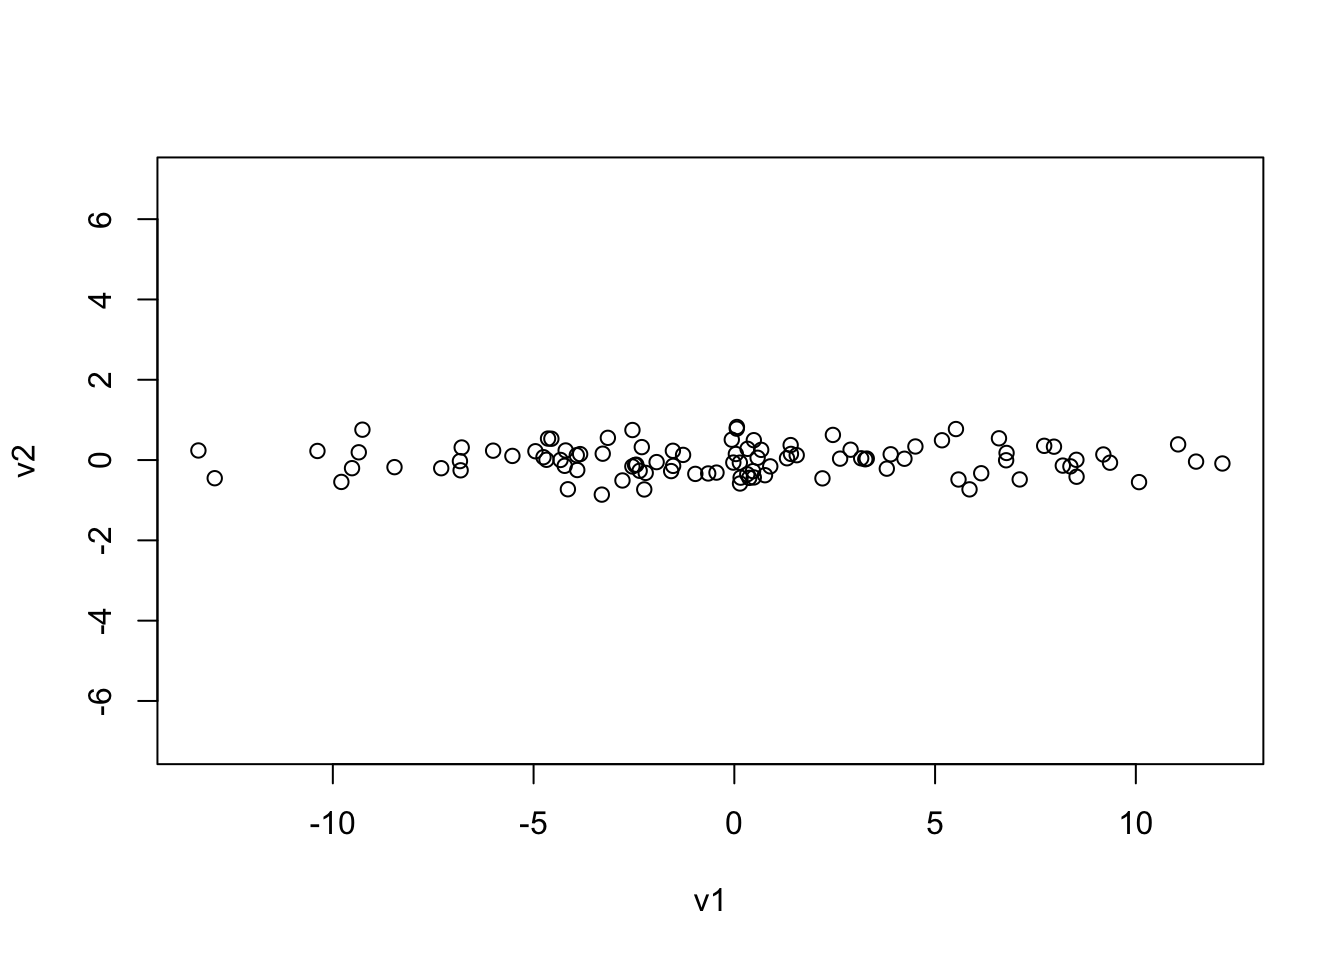
##               v1         v2
## [1,]  4.50967753  0.3381250
## [2,]  0.32191453 -0.3537179
## [3,] -3.27765247  0.1587313
## [4,]  3.79746409 -0.2139939
## [5,] -3.84071274  0.1484908
## [6,]  0.06434412  0.8236898